

| Mined Tree object - Tree tab | Induce | |
 After selecting a leaf node, Induce Single Node enables new splits in the tree to be induced one at a time. Such new splits cannot be induced at nodes that are not leaf nodes.
This lets you carry out interactive rule induction and pruning on selected tree nodes. By presenting evidence based on the training data it provides you control over the choice of the attribute and its values/ranges in each branch. The evidence is also provided for you to decide when further branching is not desirable, i.e. pre-pruning the tree.
The Induce Single Node function will query the training data and build up a list of attributes that provide a potential split at the highlighted leaf node. The information shown varies, depending upon whether the outcome is discrete or continuous.
You can then specify a Min examples in a branch parameter to filter out splits which fall below a given number of data records (rows). Attributes which fall below this will be appear in the list with 'Min' against them to indicate that they are below this threshold.
When the outcome is a discrete value
This list is sorted on the basis of the entropy measure (as in the example shown following). The less the entropy value the better the attribute (zero entropy gives 100% classification. The Entropy value is shown for each attribute as well as the Chi-square value, which is another measure of relative importance, and its corresponding significance level (S/L). The significance level provides a criteria for terminating further branching. Ironically here the higher the significance level (S/L) the less is the attribute 'significance'.
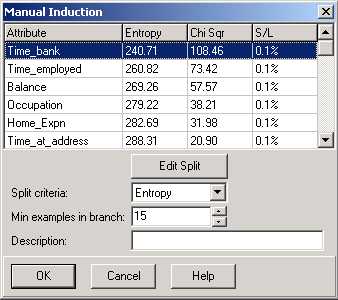
You can Sort the list of attributes in order according to either Entropy or the Chi-square test. Pressing the OK button will insert the selected attribute in the highlighted node of the current tree, thus creating two new leafs.
Pressing the Edit Split button provides detailed information about the selected attribute. For discrete attributes (as in the example shown below), the zoom button will display the values assigned for each of the two branches with their corresponding frequency, and the rate of a selected outcome to the total in the branch. You can use the right mouse click on a group/value to transfer it to another branch, updating the totals and rates for both branches.
For continuous attributes the Edit Split button will display the 'best' threshold derived by the system for the selected attribute. The first branch shows the frequency of examples falling below the threshold while the second branch shows the frequency of examples falling at or above the threshold. The outcome rate is also displayed for each branch.
Pressing OK on the Edit Split dialog box will confirm the values/ranges in the two branches. If these changes cause a change in the entropy or Chi-square values, then the list of attributes is updated and re-sorted accordingly.
When the outcome is continuous
The process of inserting branches is very similar to the above when you are using a discrete value outcome. However, different evidence is offered on which to base your decisions about branching when you are using a continuous (numeric or date/time) outcome:
Instead of entropy and chi-square, you are shown the Normalised Standard Deviation and F-test values. The Edit Split button again gives two variants of dialog box, depending upon whether you select a discrete attribute or a continuous attribute from the above list. For a discrete attribute, the Frequency, Mean and Standard Deviation values are listed. You can move values from one branch to the other by using the right mouse click.
For a continuous attribute, the Edit Split button shows the threshold split.
See Building trees interactively.
 You can later select an attribute on the tree and use the Inspect Node function to see the evidence used when a branch was created.